Overview
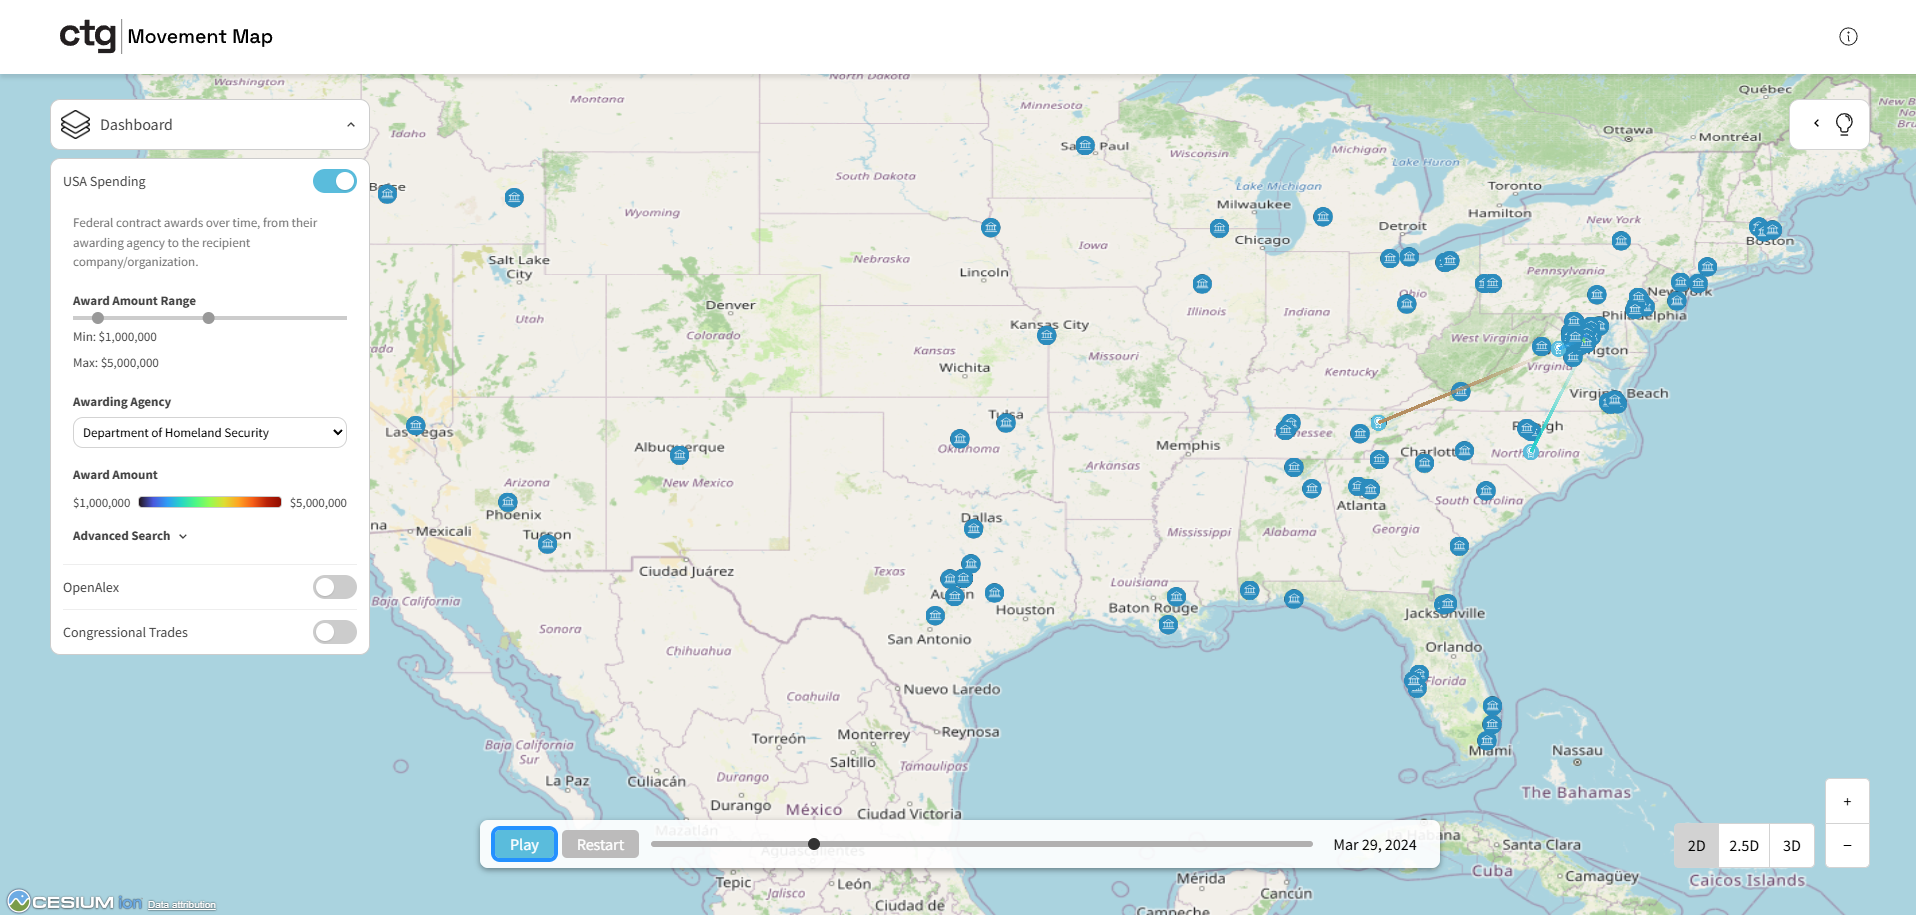
Built during a summer internship at Capital Technology Group: a full-stack geospatial platform that maps research-funding flows, government spending, and congressional-trade anomalies on a live 3D globe. Live at movementmap.capitaltg.dev.
The catch: the source data was 270 million records, and the platform was slow enough that you could feel it.
Schema and API
I designed a STAR-inspired PostgreSQL schema for the funding/spending data and built the Spring Boot REST API that serves it. The performance work was deliberate, not accidental: strategic indexing plus endpoint-specific DTOs (so no endpoint sends more data than its caller actually renders) cut application load times by over 80%.
The ETL problem
270M raw records was never going to be queryable interactively. I built a Python ETL pipeline that filtered the dataset down to a workable 3.2M records, and stitched together complex authorship data from multiple API endpoints: the difference between a demo and a real platform.
The five-day frontend pivot
With two weeks left in the internship, I moved from backend to frontend cold, on Vue.js and Cesium, neither of which I’d touched before. I delivered the InsightsLayer feature in five days, including untangling event-listener race conditions between the globe and the UI layer.
Result
Shipped and still live: a 270M-row bottleneck turned into a working platform, load times down 80%+, and a frontend feature delivered in five days on a stack I’d never used before. The full arc (schema, pipeline, API, globe) in one summer.